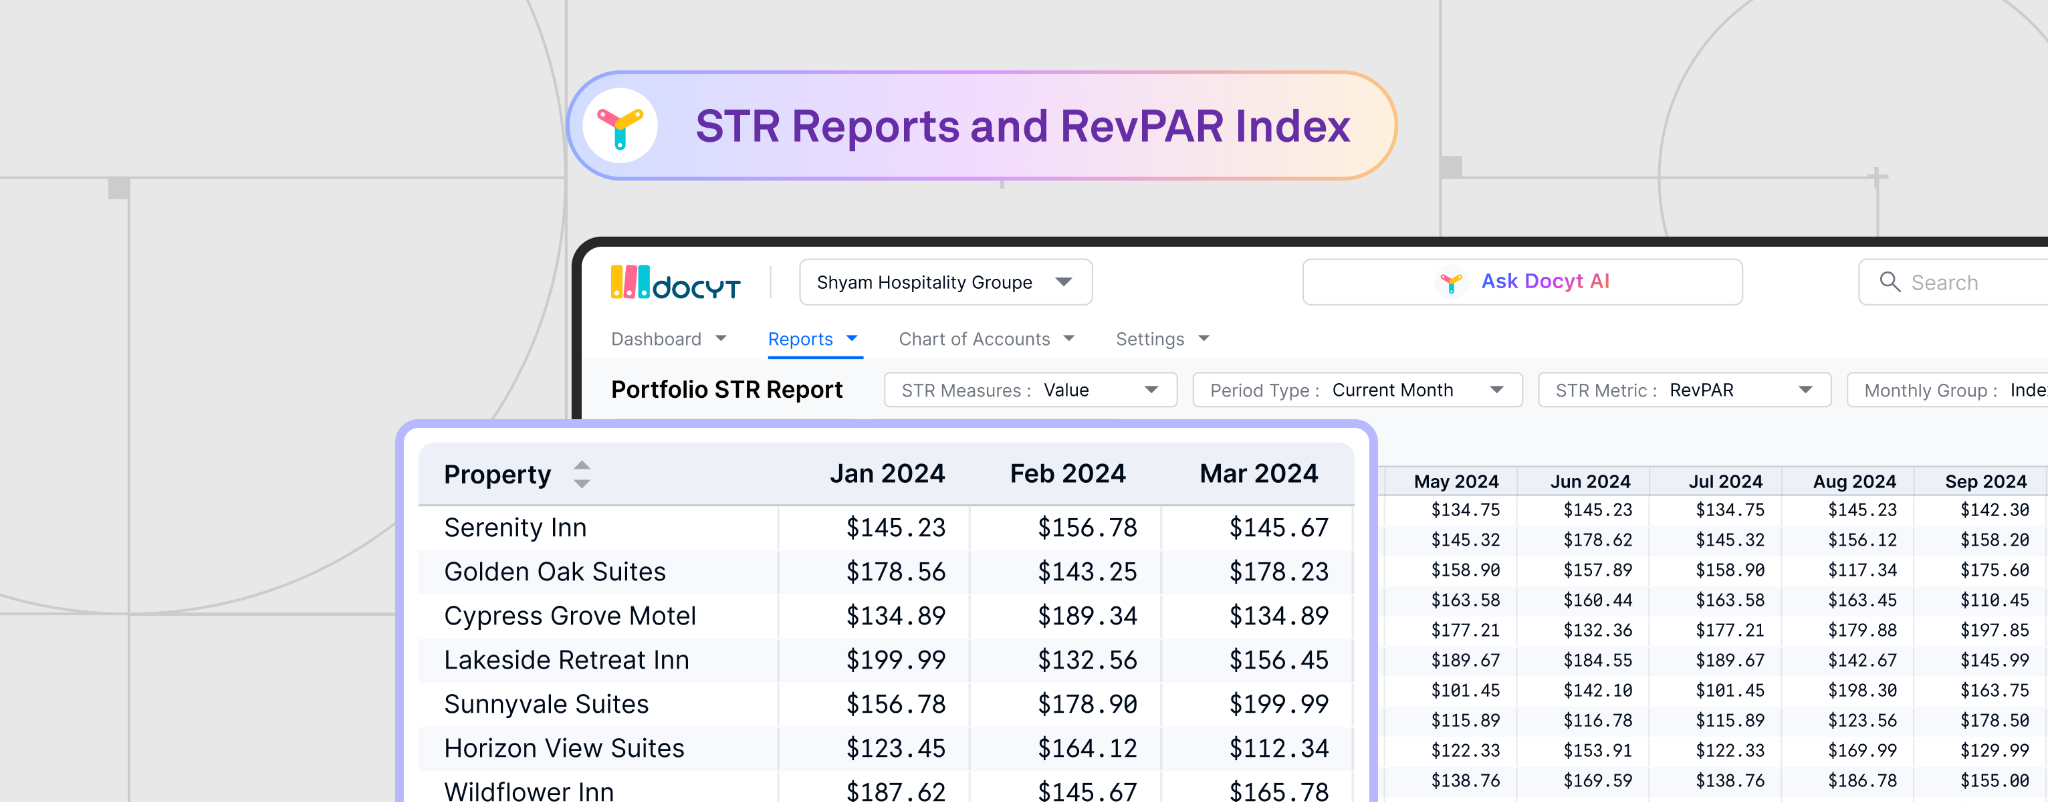
RevPAR is often the first number that owners and operators look at – and for good reason. It is simple, direct and perfectly ties together both occupancy rate and daily rate into one easy-to-compare figure.
As the most tracked metric in the hotel business, RevPAR gives you a solid sense of how much revenue you’re generating for each room available.
But those hoteliers who regularly work with STR (Smith Travel Research) reports know that RevPAR, while fundamental, is only a surface-level revenue metric with its limitations.
RevPAR is Your Score, Not Your Rank
While a consistent increase in RevPAR often appears to be a good sign, it’s truly positive only if it’s contributing to profit, which one may or may not know until they dig deep.
For example:
- An increased RevPAR could be due to higher prices simply caused by increases in underlying operational costs. A positive growth in RevPAR in this case is not exactly as positive as it seems.
- A higher RevPAR might sometimes come at the expense of soaring expenses, such as elevated commissions or even higher marketing spend, which ultimately lead to a lower net profit per room.
Moreover, a RevPAR growth without the proper competitive context can be ambiguous. A RevPAR of $90 over $80 last quarter is a positive sign, until you realize competitors are averaging $110.
So, without comparing your RevPAR to your direct competitors via the RevPAR Index, you don’t honestly know if your “increase” is an underperformance against the overall market trend.
In short: RevPAR gives you your score, but it doesn’t accurately tell you how you are truly faring in the competitive market. This is precisely why hoteliers leverage the RevPAR Index from STR reports.
RevPAR Index = Your Rank on the Leaderboard
The RevPAR Index (sometimes called Revenue Generating Index or RGI) measures how well a hotel is generating room revenue compared to its direct competitors or a selected market segment.
RevPAR Index = (Your Hotel’s RevPAR ÷ Competitors’ Average RevPAR) × 100
A RevPAR index of 100 indicates that the hotel is capturing its “fair share” of the market.
Above 100 points that you are outperforming your competitive set, while below 100 means underperformance relative to competitors.
Together, here’s RevPAR & RevPAR index offer an accurate insight into the revenue performance of the hospitality property:
- Both RevPAR and RevPAR Index rise: Your property is growing and outpacing the market – Winning!
- RevPAR grows, but RevPAR Index is falling: Your property grows, but competitors improve faster. And you are losing market share!
- RevPAR falls, but RevPAR Index grows: The market falls even faster than you are gaining market share in a tough market!
- Market Segmentation Analysis: Understand exactly which guest segments are boosting or dragging your Index. Focus your efforts where the returns are highest.
- Real-Time Labor and Expense Control: Know your cost centres inside out. Adjust labor and expenses dynamically to improve margins, even when RevPAR stays flat.
- Dynamic Budgeting and Forecasting: Use your STR insights to update financial plans instantly, ensuring your strategy always matches market movement.
- Actionable Dashboards for GMs: Give your general managers data they can use – clear, focused, and tied directly to daily operations and RevPAR goals.
What Makes RevPAR Indefensible for Hoteliers?
While RevPAR shows how much you earn per room & RevPAR Index gives how you rank versus others in the market, and together they give you an accurate representation of your current state.
That said, the importance of RevPAR index goes beyond telling you exactly how your hotel’s “score” compares to your closest competitors:
1. Reveals your true market share: The RevPAR Index indicates your share in the pie by indicating how much revenue you’re capturing compared to your competition.
2. Reflects Strategy & Forces Deeper Analysis: A high Index means your strategy is working and you are pulling ahead. Dropping numbers indicate that something needs attention – pricing, promotions, operations, or all of them.
3. Shows Opportunity for Growth: The Index points to what’s missing. Are your rates too low? Are others offering better value? It encourages you to rethink, realign, and take back share from competitors
And yet, even with access to RevPAR Index, most hotels still don’t make the right decisions to act on it. That’s not because the data is flawed; it’s because they lack the right tools to turn it into operational change.
To truly optimize based on your RevPAR Index, hotel operators need to pair it with detailed financial and operational data. That’s where the gaps start to show.
Why Most Hotel Owners Fall Short with RevPAR Index
The RevPAR Index tells you what’s happening, but not why.
You might notice your Index drop from 102 to 89 over a few weeks. That’s useful to know; but without more information, you’re stuck with questions. Is labor cost running too high? Did a specific channel underperform? Is a competitor undercutting you on rate?
Understanding what’s driving the change is where most hotel operators hit a wall.
And even those who know they need to dig deeper often struggle with the slow, manual process of compiling and cross-referencing financial data with STR metrics.
By the time that analysis is complete, the moment may have passed. Market conditions change quickly, and opportunities disappear just as fast.
In the context of RevPAR, the delay between insight and action is the difference between winning and losing the market share.
STR Reports and RevPAR Index Are Rank Cards – The Right Accounting Solution Turns Them into Game Plans
Knowing your market score and rank is valuable. But knowing how to improve it is what tilts the game in your favour.
And this is where AI-powered hotel bookkeeping and business intelligence solutions like Docyt AI chip in to help.
Docyt AI helps hotels turn financial and operational data into real-time, revenue-driving decisions that allow you to act on your RevPAR Index on the fly.
Here’s how Docyt helps you close the gap:
- Market Segmentation Analysis: Understand exactly which guest segments are boosting or dragging your Index. Focus your efforts where the returns are highest.
- Real-Time Labor and Expense Control: Know your cost centres inside out. Adjust labor and expenses dynamically to improve margins, even when RevPAR stays flat.
- Dynamic Budgeting and Forecasting: Use your STR insights to update financial plans instantly, ensuring your strategy always matches market movement.
- Actionable Dashboards for GMs: Give your general managers data they can use – clear, focused, and tied directly to daily operations and RevPAR goals.
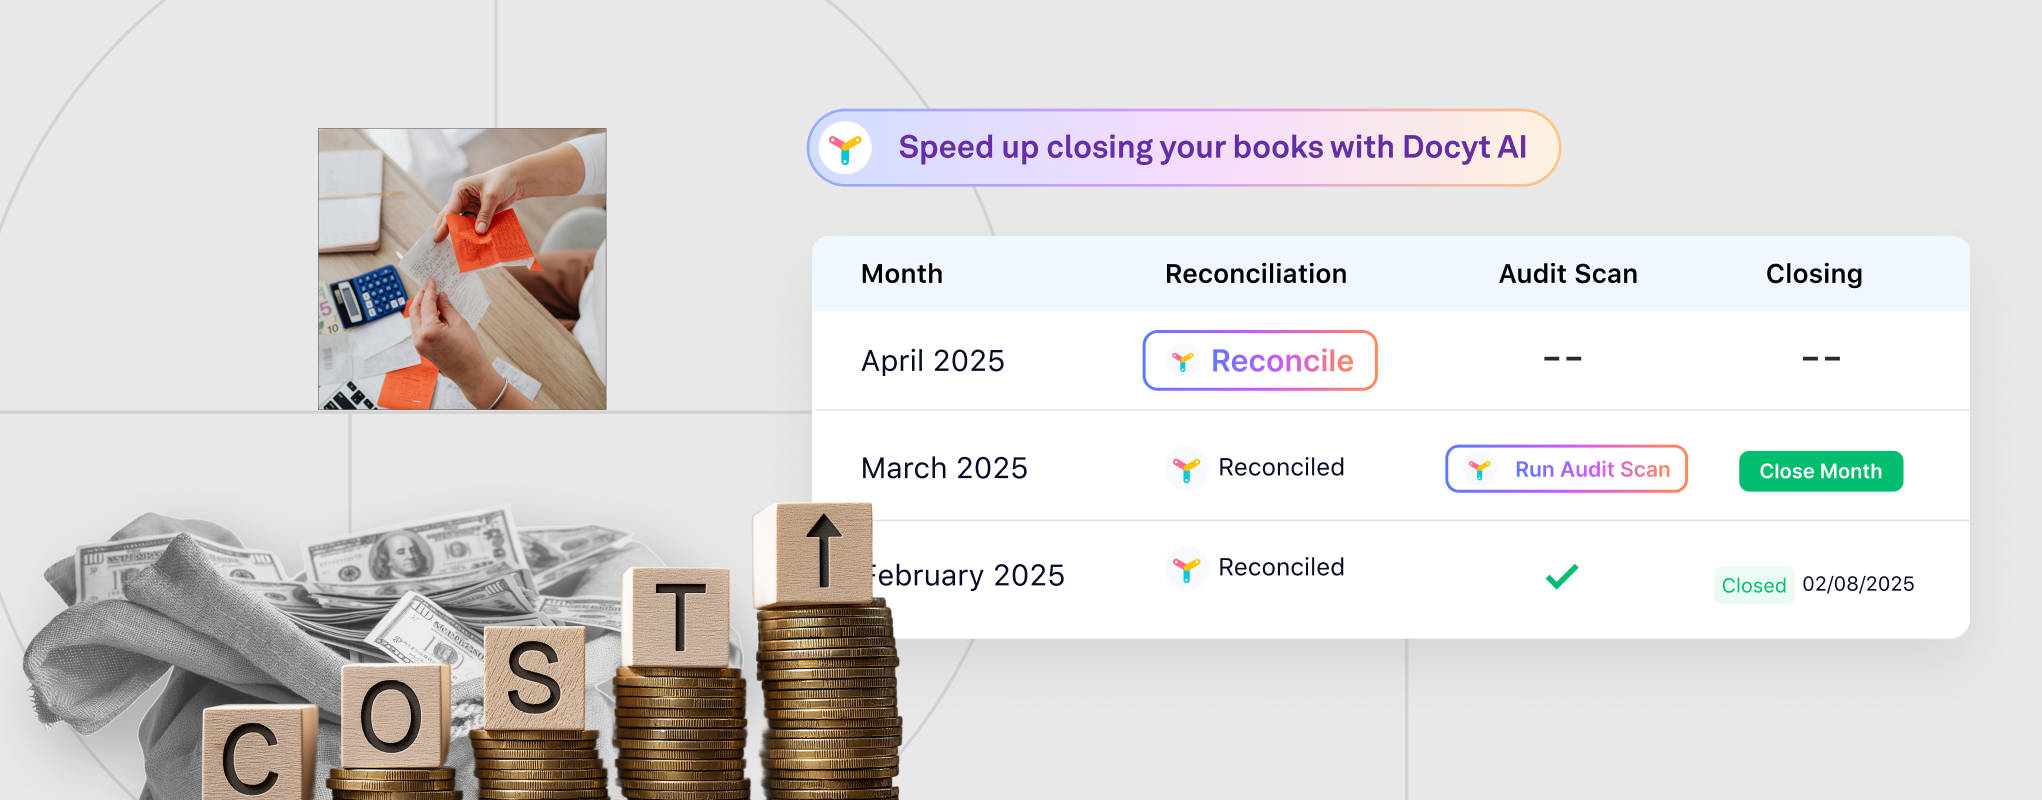
With Docyt, all of this happens in real time. From revenue reconciliation to portfolio-wide reporting, you get a living, breathing view of your hotel’s financial health, aligned with your STR report and RevPAR Index.
And if you already have a tech stack in place? No problem. Docyt’s flexible system works alongside your existing tools, adding intelligence and clarity without requiring a complete system overhaul.
Stop just reading your RevPAR Index in the STR report. Start acting on it, with Docyt AI.


